
Scenarios for Inflation in 2023: Base Effects in Action
June 1, 2023
According to the May Survey of Professional Forecasters (SPF), the consensus predicts that headline and core personal consumption expenditures (PCE) price inflation will slow further in 2023, but that the decline in core inflation will be slower. The consensus predicts that headline (all items) inflation will slow to 3.4% in the fourth quarter of 2023 from a year earlier but that core inflation (all items except for food and energy) will slow to 3.7%.
The projected smaller decline in core inflation is consistent with the fact that it tends to be more persistent (“stickier”) than headline inflation. Headline inflation is generally more volatile because of swings in food and energy prices.
Slow progress on the inflation front also appears to be the view of the Federal Open Market Committee (FOMC). In his press conference following the May 2-3 FOMC meeting, Fed Chair Jerome Powell said that “the process of getting inflation back down to 2% has a long way to go. (PDF)” But how long?
Elements That Influence the Pace of Disinflation
The pace of disinflation over time ultimately depends on the stance of monetary policy. Over shorter horizons, such as over the past year, other factors are at work. First, in any one month, prices of some goods and services will be below their year-earlier levels experienced in previous months while others will exceed their year-earlier levels. Second, the calculated pace of disinflation will also depend on the weights of each good and service. For example, housing and medical care have the two largest weights in the PCE price index (PCEPI), comprising about 24% and 22%, respectively, in December 2021. Thus, large increases in prices of goods and services with large weights will, all else equal, lead to relatively large increases in the overall price index.
A third factor that helps determine the pace of disinflation are “base effects.” This simply means that if inflation is measured on a 12-month basis, then relatively large or small changes a year earlier will slow or speed up the current price change.
The Impact of Base Effects on 2022 Inflation
The two tables below illustrate these effects using monthly changes in 2021 and 2022 and the corresponding 12-month percent changes in 2022.
Focusing first on headline inflation, monthly percent changes over the first three months of 2022 exceeded those from a year earlier. In response, inflation on a 12-month basis accelerated from 6.1% in January to 6.8% in March. Conversely, monthly percent changes over the last three months of 2022 were less than a year earlier and inflation fell from 6.1% in October to 5.3% in December.
| Month | 2021 | 2022 | Percentage Point Difference | 12-Month Change |
|---|---|---|---|---|
| January | 0.39% | 0.53% | 0.14 | 6.1% |
| February | 0.34% | 0.59% | 0.26 | 6.4% |
| March | 0.59% | 0.95% | 0.36 | 6.8% |
| April | 0.53% | 0.20% | -0.33 | 6.4% |
| May | 0.51% | 0.61% | 0.10 | 6.5% |
| June | 0.56% | 0.99% | 0.43 | 7.0% |
| July | 0.46% | -0.09% | -0.55 | 6.4% |
| August | 0.39% | 0.27% | -0.13 | 6.3% |
| September | 0.31% | 0.34% | 0.03 | 6.3% |
| October | 0.57% | 0.42% | -0.15 | 6.1% |
| November | 0.61% | 0.17% | -0.44 | 5.7% |
| December | 0.54% | 0.20% | -0.34 | 5.3% |
| SOURCES: Bureau of Economic Analysis and author’s calculations. | ||||
Not surprisingly, a similar pattern occurred with core inflation. When the monthly percentage increases in 2022 exceeded the increases in 2021, the 12-month change in core PCEPI increased, and vice versa.
| Month | 2021 | 2022 | Percentage Point Difference | 12-Month Change |
|---|---|---|---|---|
| January | 0.31% | 0.47% | 0.16 | 5.2% |
| February | 0.17% | 0.37% | 0.20 | 5.4% |
| March | 0.42% | 0.37% | -0.05 | 5.4% |
| April | 0.63% | 0.31% | -0.32 | 5.0% |
| May | 0.52% | 0.38% | -0.14 | 4.9% |
| June | 0.48% | 0.63% | 0.15 | 5.0% |
| July | 0.39% | 0.08% | -0.32 | 4.7% |
| August | 0.33% | 0.55% | 0.22 | 4.9% |
| September | 0.21% | 0.46% | 0.26 | 5.2% |
| October | 0.41% | 0.31% | -0.09 | 5.1% |
| November | 0.52% | 0.22% | -0.29 | 4.8% |
| December | 0.54% | 0.37% | -0.17 | 4.6% |
| SOURCES: Bureau of Economic Analysis and author’s calculations. | ||||
What’s the Role of Base Effects in Near-Term Inflation?
So, how might the path of headline and core inflation play out over the next 12 months? The next two figures show several possible paths of headline and core inflation over the next year.
The figure below shows the paths for headline inflation under three different scenarios. The first scenario assumes that the monthly change in PCEPI averages 0.34% per month, which has been its average over the first four months of 2023. In this scenario, base effects temporarily lower inflation from its current 4.4% in April to 3.4% in June. Thereafter, under this scenario, inflation will steadily increase to 4.2% by April 2024.
In the other two scenarios, the monthly change in the headline PCEPI is assumed to average either 0.1% or 0.2% per month. In both cases, headline inflation continues to steadily decline, on net, over the next 12 months.
Headline PCE Inflation and Forecasts under Different Scenarios
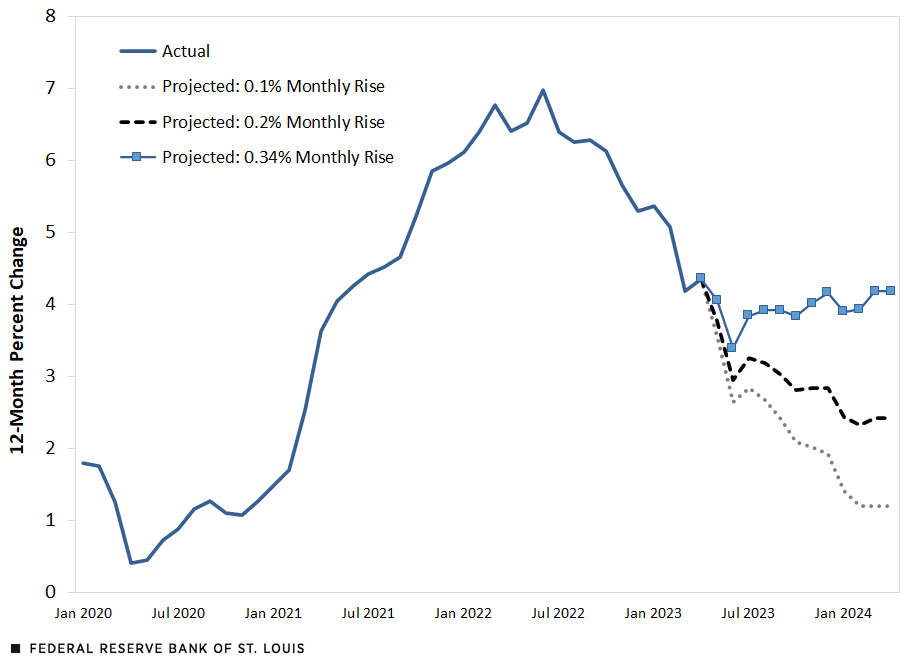
SOURCES: Bureau of Economic Analysis and author’s calculations.
The next figure below shows a similar exercise for core inflation. In the first scenario, the core PCEPI averages 0.4% per month over the next 12 months, which is its actual average increase per month over the first four months of 2023. In this scenario, there is no disinflation: core inflation remains high over the next 12 months, reaching about 5% in April 2024.
The other scenarios are more promising. In the second scenario, the PCEPI increases by an average of 0.3% per month; in the third scenario, by 0.2% per month; and in the fourth scenario, by 0.1% per month over the next 12 months.
Core PCE Inflation and Forecasts under Different Scenarios
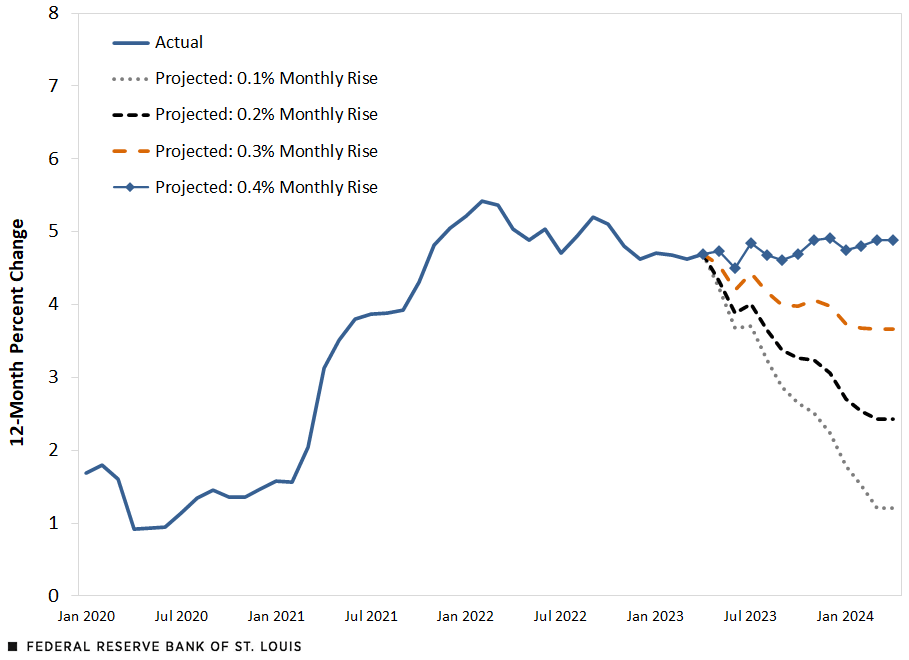
SOURCE: Bureau of Economic Analysis and author’s calculations.
If the core PCEPI increases by an average of 0.3% per month, then core inflation will slow to 4% in December 2023 and then to 3.7% in April 2024. In the third scenario, core inflation will fall to 3.1% in December 2023 and then to 2.4% in April 2024. Finally, the fourth scenario—PCEPI increases by an average of 0.1% per month—core inflation falls to 2.2% in December 2023 and then to 1.2% in April 2024.
Based on the SPF consensus, forecasters are expecting that monthly gains in core PCEPI will average less than 0.3% per month over the final nine months of 2023. The figures in this blog post show what would occur if the average monthly gains turned out to be larger or smaller than the SPF consensus.
Leave a Reply
You must be logged in to post a comment.