
A Look at China
April 22, 2014
This week, China announced their real GDP had grown 7.4 percent from a year ago in the first quarter, slightly below the 7.5 percent annual target and slightly ahead of the 7.3 percent consensus. There was a collective sigh of relief and widespread commentary that China was back under control and that the mini-stimulus plan announced last week would stabilize growth. To reinforce this point, China announced further reforms and prodding to the economy this week. We are not so sure. Also during the week, annual growth in rail traffic fell again in March bringing the first quarter total down to -3.5 percent. Electricity use rose year on year to 6.2 percent in March from 5.5 percent in January-February, bringing that key real activity indicator to 5.7 percent for the quarter – down from 7.6 percent in 2013, when real growth was 7.7 percent. Along with banks loans, which have been crunched by the twin crackdowns on corruption and construction, these are the three keys of the Li Keqiang GDP measurement rule.
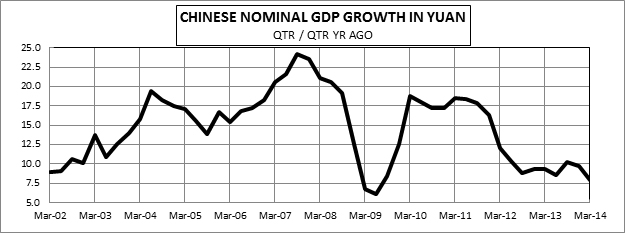
However, the most important piece of data in our view was that nominal GDP in yuan for the first quarter rose an anemic 7.9 percent from a year ago. It is nominal yuan that are used to service debt, pay workers, buy imported goods, and represents the profits that fund capital investment. Economies generally can stay out of trouble if nominal GDP growth is faster than the interest rate charged on debt – as borrowers can grow their way to profits. In the decade from 2003 to 2012, Chinese nominal yuan GDP averaged a 16.0 percent growth rate – with only a brief dip below double digits during the Lehman crisis. Debt service was never a problem even at high underground interest rates. First quarter of last year, annual nominal yuan growth slowed to 9.4 percent, and this year to 7.9 percent. Trust companies promise double digit returns by lending to troubled developers who can no longer count on a strong tailwind from growth. Dominos should start to fall – likely taking nominal growth even lower unless Beijing ramps up a more aggressive stimulus, which they say they will not.
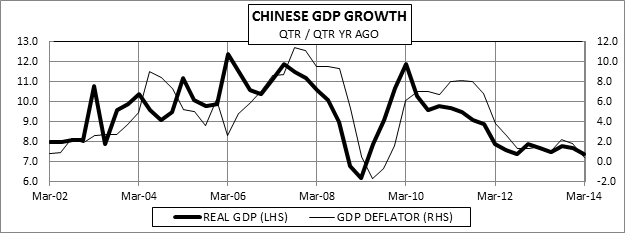
The implicit decline in inflation to a 0.4 percent annual rate that comes out of the 7.9 percent nominal and a 7.4 percent real growth rates for the past year is a confirmation of the slowing trend. Though we are always cautious about the quality of Chinese data, we do believe it is easier to collect nominal data on actual yuan receipts than it is to make proper price adjustments. Thus, we trust the down trend in nominal data the most. However, the strong correlation between Chinese real GDP growth and inflation in the GDP deflator, with a brief lag, also makes sense theoretically. We feel it would be hard for official bean counters to create this relationship in an arbitrary way. CPI and PPI data conform the slowing of inflation just as weak ISMs confirm weak growth. So while we may worry about the absolute levels of these various growth rates, it appears clear that nominal growth, real growth and inflation are all slowing in China. This trifecta, along with all of the other key indicators, suggests that China’s buying power is fading – which may be more of a problem for commodities producers and their financiers than for China itself.
The preceding is an abridged version of a commentary for McVean Trading and Investments, LLC and has been reposted here with permission of the author.
The ideas and opinions expressed in this blog are those of the author, and they should not be perceived as investment advice or as any other kind of advice.
Leave a Reply
You must be logged in to post a comment.